Gold or Bitcoin? A $400 median gap.
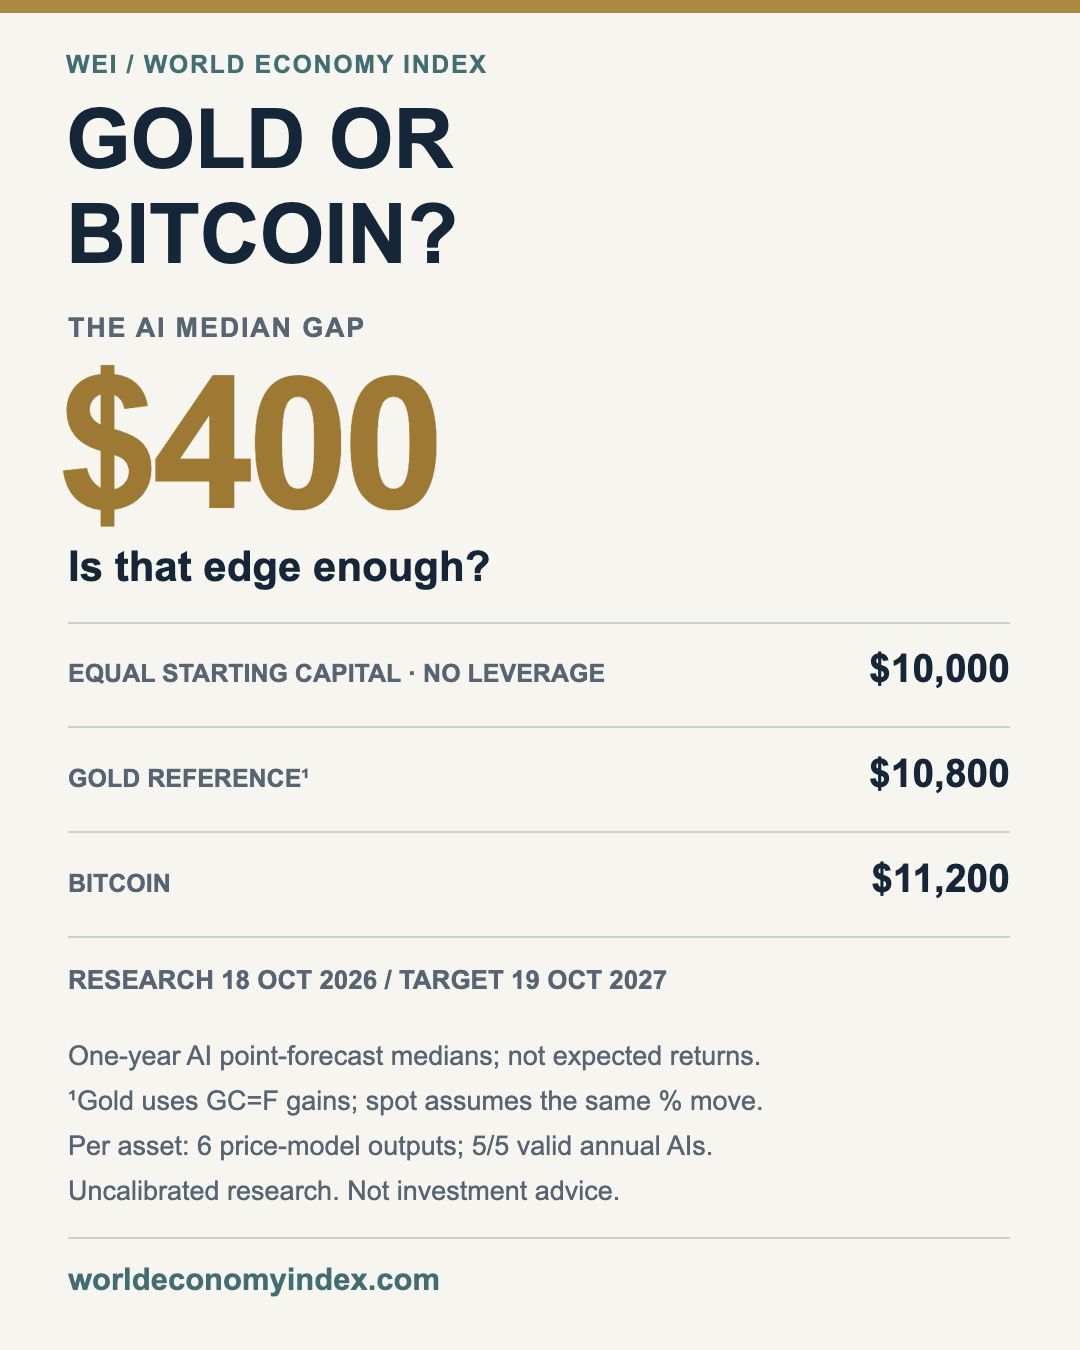
Is Bitcoin’s $400 median edge enough to choose it over spot gold for one year?
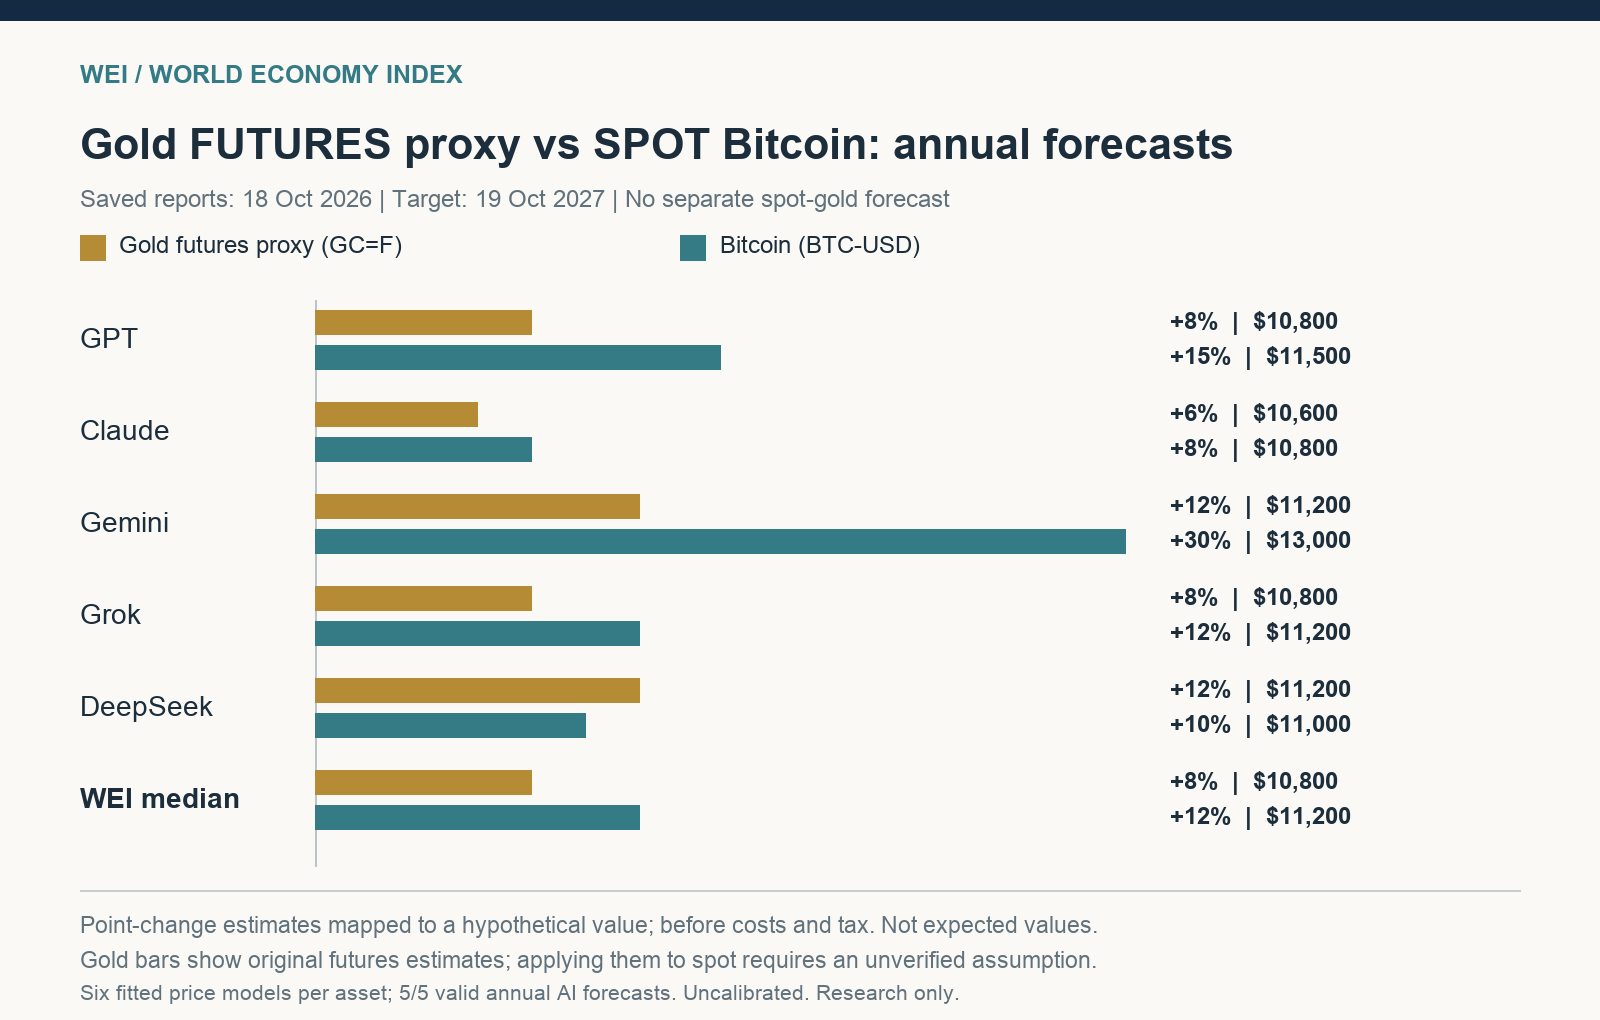
Start with the same $10,000, without leverage. In WEI’s 18 October 2026 study, the five-AI median scenarios are $10,800 for the gold reference case¹ and $11,200 for Bitcoin, targeting 19 October 2027. The gap is just $400. These are AI point-forecast scenarios, not expected returns.
Bitcoin’s earlier median forecast was a 30% gain. The reassessment puts it at 12%, cutting its advantage over gold from $2,200 to $400.
¹Gold uses the existing GC=F report’s percentage gains. Spot values assume the same percentage move; no independent spot-gold forecast was generated.
At the other extreme is a conditional warning from Bloomberg Intelligence strategist Mike McGlone: if US stocks suffer a 20% drawdown, Bitcoin could move toward $10,000. At that price, the BTC position in this comparison would be worth $1,225.20, a loss of 87.75%. McGlone’s original post, October 16.
The comparison starts with US dollars, uses no leverage and ends on October 19, 2027. Spot gold’s October 16 XAU/USD reference of $4,165.50 per troy ounce buys exposure to approximately 2.4007 ounces. The October 18 Bitcoin reassessment uses $81,619.15625, an intraday reference, giving approximately 0.1225203 BTC. Spot-gold reference.
| AI | Gold reference gain¹ | Spot-gold scenario¹ | BTC reassessed gain | BTC scenario |
|---|---|---|---|---|
| GPT | +8% | $10,800 | +15% | $11,500 |
| Claude | +6% | $10,600 | +8% | $10,800 |
| Gemini | +12% | $11,200 | +30% | $13,000 |
| Grok | +8% | $10,800 | +12% | $11,200 |
| DeepSeek | +12% | $11,200 | +10% | $11,000 |
| Five-AI median | +8% | $10,800 | +12% | $11,200 |
All five Bitcoin forecasts remain positive, ranging from 8% to 30%, or $10,800 to $13,000: a $2,200 spread. Gold’s five estimates range from 6% to 12%, a $600 spread in ending value. Bitcoin offers more upside in these estimates, with less agreement about its size.
The median Bitcoin scenario implies a price of approximately $91,413.46. A matching 8% gain in spot gold implies approximately $4,498.74 per ounce.
The crash warning, opposing view and fund-flow evidence were included in the frozen inputs shared with all five AIs. Every response discussed the $10,000 scenario; none adopted it as the one-year baseline. Their treatment of tail risk and historical price drift differed.
| AI | Earlier annual gain | Reassessed annual gain | Key explanation |
|---|---|---|---|
| GPT | +30% | +15% | Moderate upside; equity shock plus persistent ETF outflows would invalidate it |
| Claude | +12% | +8% | Crash conditions not established; sharply discounts historical drift |
| Gemini | +40% | +30% | Institutional demand; $30,000 cost support not independently recalculated |
| Grok | +18% | +12% | $10,000 is not the baseline; rejects mechanical extrapolation |
| DeepSeek | +62% | +10% | Adds >30% stock decline condition without deriving it |
| Median | +30% | +12% | $10,000 scenario changes from $13,000 to $11,200 |
Two explanations lack adequate support. DeepSeek added a claim that stocks would need to plunge by more than 30%, without deriving it. That cannot replace the 20% condition in McGlone’s post. Gemini’s purported $30,000 on-chain support is Ki Young Ju’s estimate; the underlying on-chain calculation was not independently reproduced here. Neither assertion forms a basis for this article’s conclusion.
The saved one-year Up, Flat and Down probabilities are 52%, 9% and 39% for BTC, and 63%, 4% and 33% for the gold-futures reference. They are equal-weight averages of valid AIs’ subjective probabilities, uncalibrated, with Flat defined as within ±0.5% of the reference.
The six price models remain much more bullish on Bitcoin: 51.94%–79.15% annual gains, versus 5.78%–14.85% for the gold-futures reference. Actual outputs came from ARIMA, Ridge, Random Forest, Gradient Boosting, Neural Network and an AR(1) return-trend proxy.
| Price model | Gold-futures reference | BTC-USD reassessment |
|---|---|---|
| ARIMA | +12.85% | +62.62% |
| Ridge | +5.78% | +68.13% |
| Random Forest | +12.20% | +79.15% |
| Gradient Boosting | +11.69% | +71.56% |
| Neural Network | +14.85% | +51.94% |
| AR(1) trend proxy | +12.78% | +62.81% |
These six models primarily use historical prices. ARIMA’s and AR(1)’s positive annual projections largely accumulate historical drift; the other models also learn past price relationships. They did not directly read the crash claims or incorporate future ETF subscriptions and redemptions, central-bank gold purchases or liquidation volumes. The five AIs assess news risks alongside the numerical models.
Current fund flows challenge the Bitcoin upside case. Farside’s daily table shows $228.4 million of net outflows from US spot Bitcoin ETFs over October 12–16. Listed trading days from October 1–16 sum to approximately $614.7 million of net outflows. Recent institutional flows have not produced sustained net buying. Farside flows.
For gold, the World Gold Council reports approximately $10 billion of global gold-ETF inflows in September and $31 billion in the third quarter. Estimated central-bank net purchases were approximately 289 tonnes in the second quarter. Yet gold fell 8.5% in September; the Council’s commentary points to rising yields, a stronger dollar and shrinking futures positioning. ETF report; Central-bank data; September commentary.
Interest rates pressure both assets. On September 16, the Federal Reserve raised its target range by 25 basis points to 3.75%–4%. September US CPI rose 3.7% year over year and 0.6% month over month. Inflation can support demand for scarce assets while keeping interest rates and financing costs elevated. Fed decision; BLS inflation data.
The crash thesis is about risk assets losing buyers together. McGlone links tighter monetary policy, higher government-bond yields and a possible US stock-market drawdown to pressure on Bitcoin. He identifies a roughly $10,000 price level, without a firm one-year deadline or calibrated probability. Original view; Yahoo Finance syndicated report, October 18.
CryptoQuant founder and CEO Ki Young Ju disputes the $10,000 case. His October 16 response places on-chain cost-basis support near $30,000. In his estimate, $10,000 would imply an MVRV of about 0.2, below the historical low of about 0.6 he cites. This is his valuation rebuttal; holder cost bases cannot guarantee a price floor. Ki Young Ju’s original post; Report comparing the views.
| BTC price scenario | $10,000 position value | Principal change |
|---|---|---|
| $91,413.46: WEI annual median | $11,200.00 | +12.00% |
| $30,000: Ki Young Ju’s discussed support | $3,675.61 | −63.24% |
| $10,000: McGlone’s conditional downside | $1,225.20 | −87.75% |
Bullish rumors also need actual buying behind them. Saylor’s Tracker post has been interpreted as a possible signal of further purchases, but the corresponding new purchase quantity has not been verified. Claims of a Bitcoin “rescue” lack a formal policy decision. The US Strategic Bitcoin Reserve starts with forfeited BTC; strategies to acquire more must be budget neutral. That does not establish new open-market buying. Tracker report; Reserve executive order.
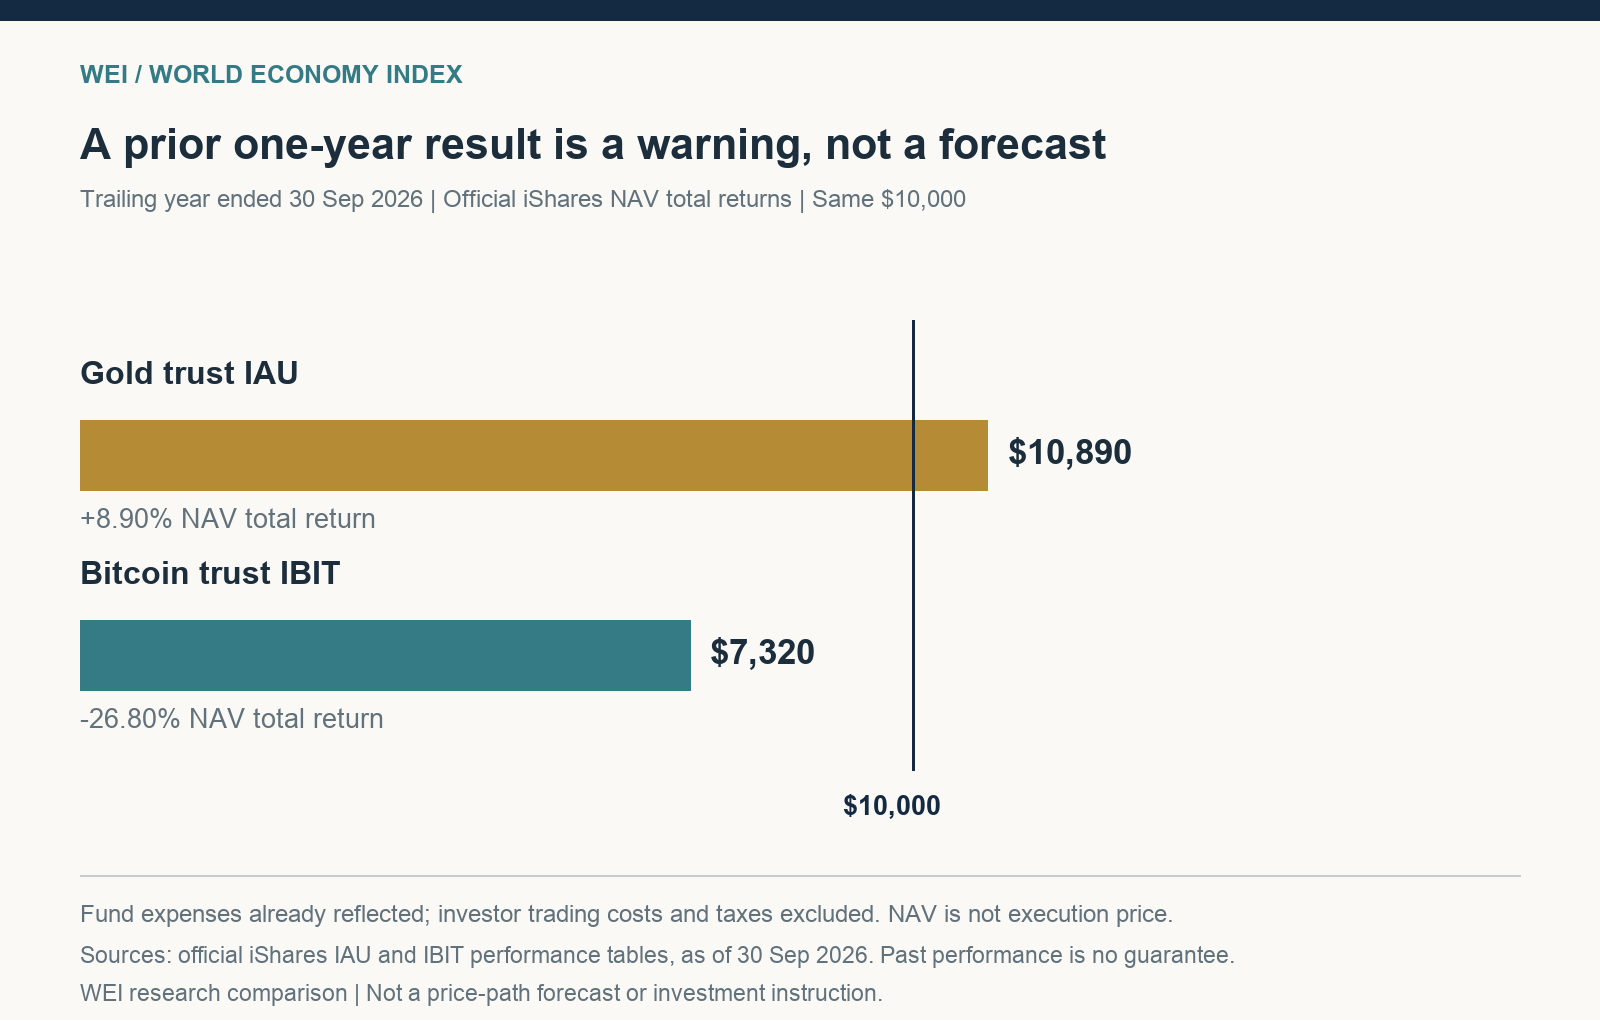
Over the past year, gold actually won. For the year ended September 30, 2026, gold trust IAU returned +8.90% on a NAV total-return basis; Bitcoin trust IBIT returned −26.80%. Equal $10,000 positions become $10,890 and $7,320, a $3,570 difference. The trusts hold the respective spot assets; fund expenses are already reflected in NAV. This comparison uses fund NAV returns. IAU official returns; IBIT official returns.
If forced to choose one for a fixed one-year holding period, this article favors spot gold. Bitcoin’s latest median scenario adds only $400. That premium depends on renewed institutional demand, easing ETF outflows and no deep equity shock. Gold can fall too, but ETF and central-bank buying provide observable support, and its five AI forecasts differ less.
For Bitcoin to reach the $11,200 median position value, watch whether ETFs return to sustained net inflows and whether buyers absorb selling during stock-market declines. A deep equity drawdown combined with persistent ETF outflows would challenge the five AIs’ positive annual bias. For gold, watch the persistence of ETF and central-bank buying, the dollar and real interest rates.
Research date: October 18, 2026. Gold report recorded at 16:41:02 Toronto time; BTC reassessment recorded at 18:43:37. Both annual targets: October 19, 2027. Each asset has 6 actual price-model outputs and 5/5 valid annual AI forecasts. AIs assess news; numerical models do not directly ingest text. Probabilities are uncalibrated; point forecasts are not expected returns. Research only; not personal investment advice.