Gold Is Falling. What Should You Do?
A century of falls—and recoveries
When gold falls, two claims recur: its era is over, or it must rebound immediately. History is unkind to both. Gold has lost 40% or 60% through prolonged bear markets, and has also been sold during financial crises before recovering.
WEI’s conclusion is: Buy. The argument is that gold has retained its capacity to be repriced through changing monetary systems, financial crises and interest-rate cycles. The record must include its worst years.
One century, different monetary systems
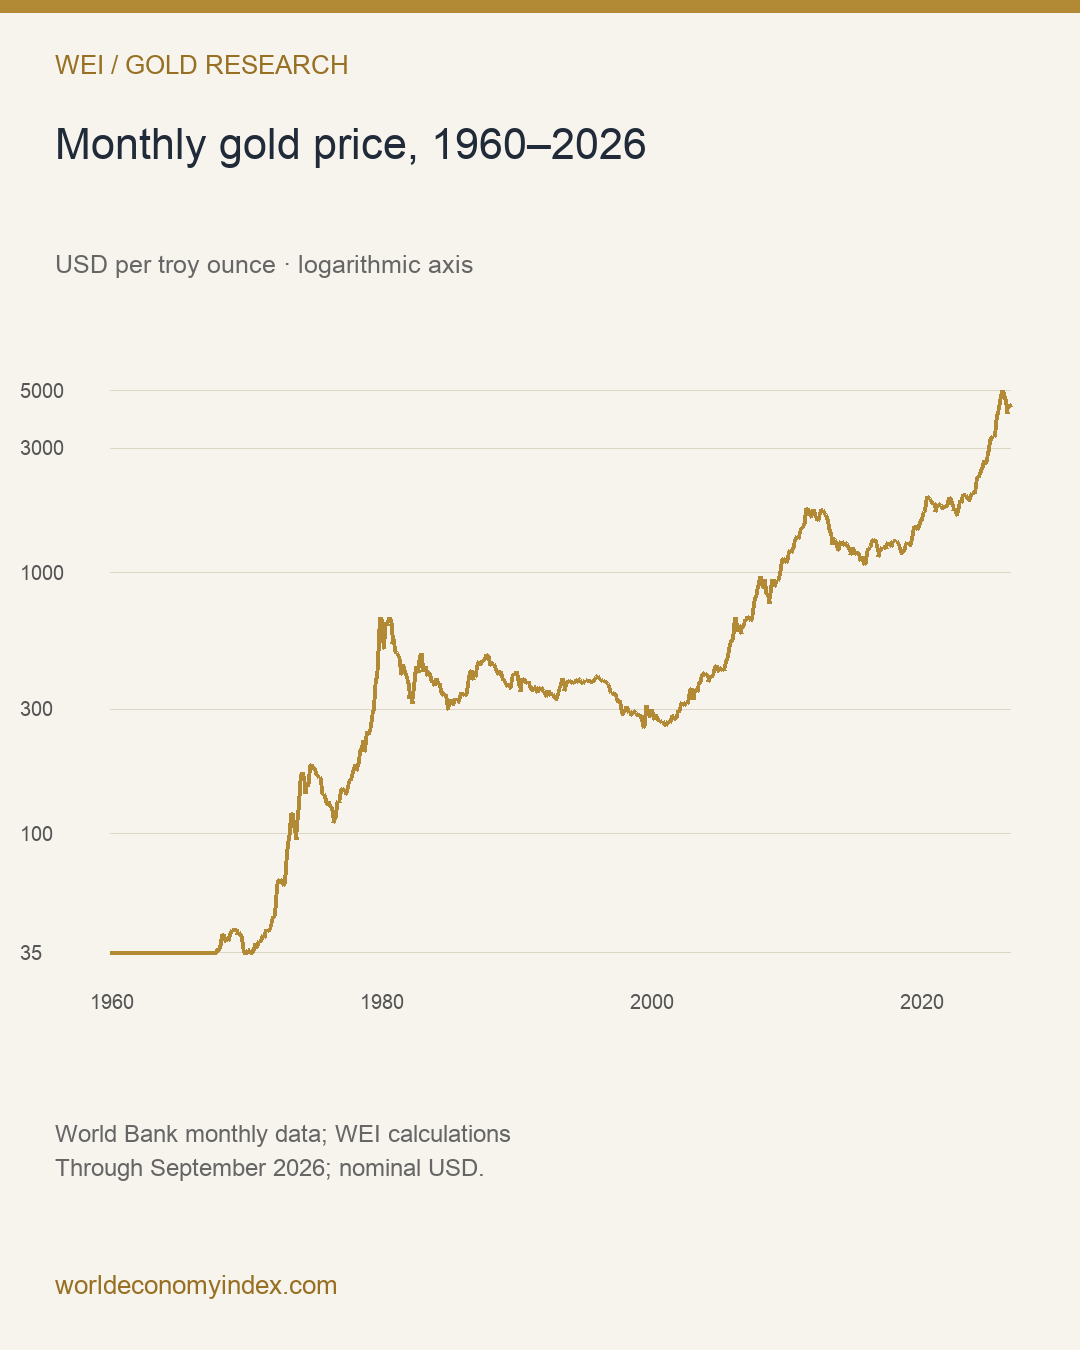
The years 1926–2026 cannot all be treated as today’s freely traded dollar gold market. The US official price was long fixed at $20.67 per ounce, raised to $35 in 1934. In 1971 the US suspended official dollar-to-gold convertibility. A fall under a fixed official-price regime differs from a floating-market drawdown. [1][2]
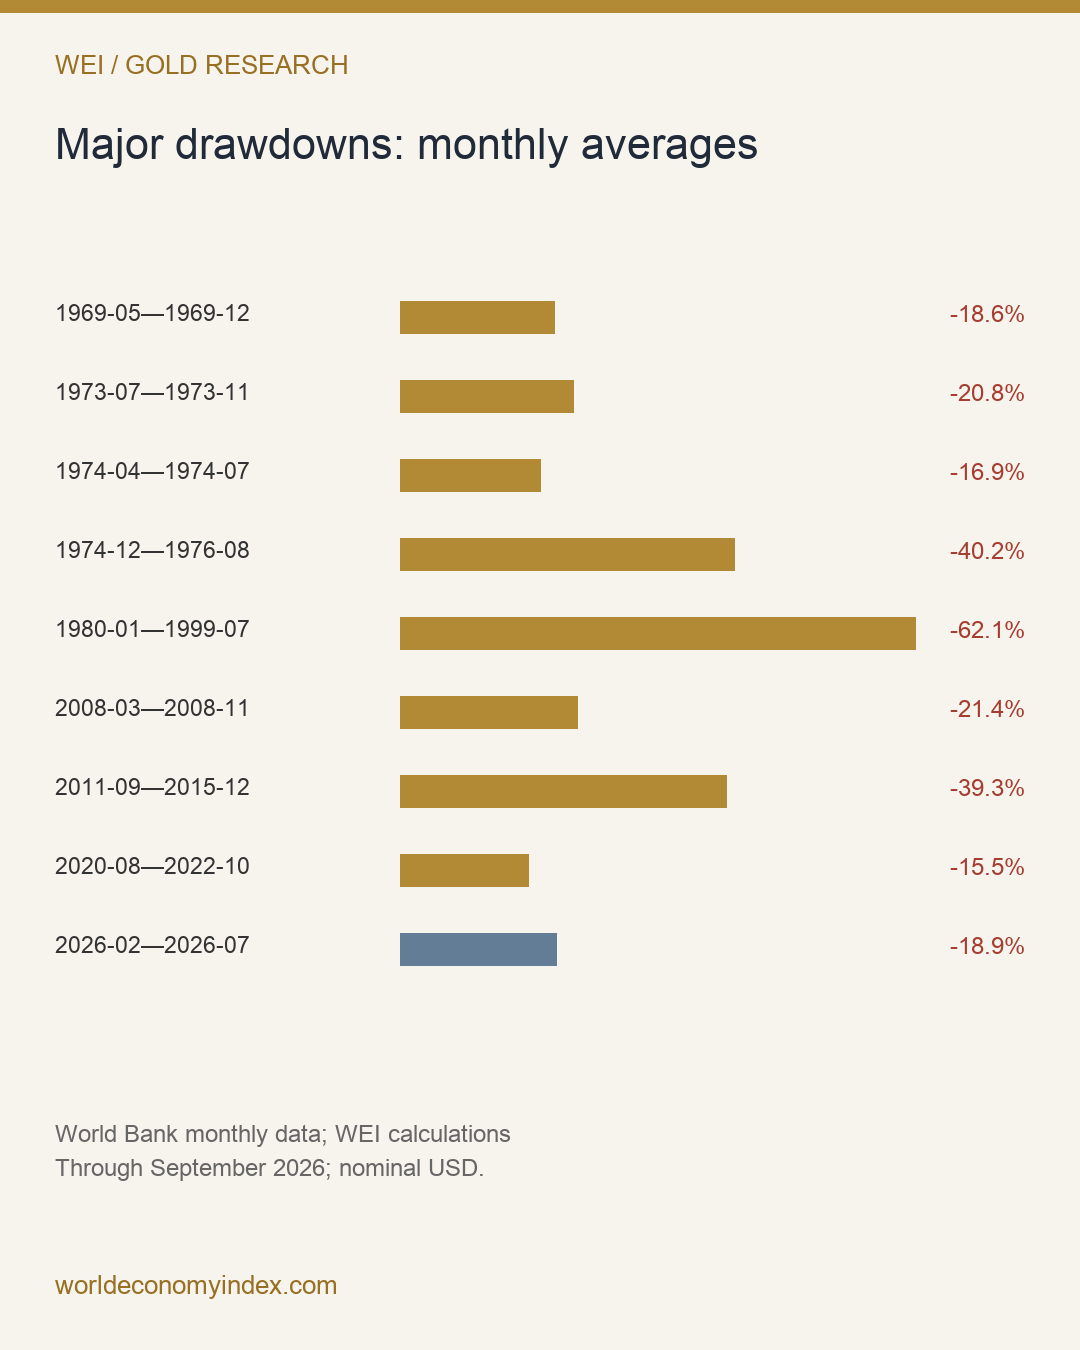
For consistent calculations, the table uses World Bank monthly data from January 1960 through September 2026. A major drawdown means a fall of at least 15% from a previous record monthly average, with the episode ending when that level is first regained. Interim rallies and renewed falls within a long bear market are not counted as separate completed episodes. [3]
Every major episode: dates, fall and outcome
| Peak → trough | USD/oz | Fall | Recovery | From peak |
|---|---|---|---|---|
| 1969-05 → 1969-12 | 43 → 35 | -18.6% | 1971-08 | 27 months |
| 1973-07 → 1973-11 | 120 → 95 | -20.8% | 1974-01 | 6 months |
| 1974-04 → 1974-07 | 172 → 143 | -16.9% | 1974-11 | 7 months |
| 1974-12 → 1976-08 | 184 → 110 | -40.2% | 1978-03 | 39 months |
| 1980-01 → 1999-07 | 675 → 256 | -62.1% | 2006-05 | 316 months |
| 2008-03 → 2008-11 | 968 → 761 | -21.4% | 2009-09 | 18 months |
| 2011-09 → 2015-12 | 1,772 → 1,076 | -39.3% | 2020-07 | 106 months |
| 2020-08 → 2022-10 | 1,969 → 1,664 | -15.5% | 2023-04 | 32 months |
| 2026-02 → 2026-07 | 5,020 → 4,073 | -18.9% | Not recovered by Sep 2026 | Open |
The 1970s: a 40% fall did not end gold
From July to November 1973, the monthly average fell from $120 to $95, down 20.8%, and surpassed the former peak in January 1974. Another 16.9% fall from April to July 1974 was recovered that November. Then came a harder test: $184 in December 1974 to $110 in August 1976, down 40.2%.
Calling that the end of gold would have missed the subsequent repricing. The monthly average regained $184 in March 1978 and reached $675 in January 1980—about 514% above the 1976 trough. That does not mean every buyer captured the bottom; it shows that a severe correction can occur within a longer bull market.
1980–1999: the counterexample buyers must face
The January 1980 monthly average was $675. By July 1999 it was $256, a 62.1% decline. It did not regain $675 until May 2006: 26 years and four months after the peak.
This bear market contained rallies and renewed collapses. Its backdrop included stronger real interest rates and the dollar, followed by disinflation and official gold sales. The World Gold Council identifies real rates, the dollar, investor flows and central-bank behaviour among major bear-market drivers. [4]
Buying during a decline and buying at its final bottom are very different. A 1980 buyer and a 1999 buyer owned the same metal but paid radically different time costs. Later highs cannot erase the earlier buyer’s decades of waiting.
2008: gold can be sold in a cash crisis
The monthly average fell from $968 in March 2008 to $761 in November, down 21.4%. A scramble for cash can cause investors to sell gold too; safe-haven demand does not guarantee a rise every day.
By September 2009 the monthly average was $997, above the former peak. It reached $1,772 in September 2011, about 133% above the 2008 trough. This recovery was far quicker than the one after 1980.
2011–2015: nearly 40% down, almost nine years to recover
From $1,772 in September 2011 to $1,076 in December 2015, gold fell 39.3%. The July 2020 monthly average of $1,847 finally exceeded the old high: eight years and ten months after the peak, or four years and seven months after the trough.
A correct long-term direction does not make every entry date correct. Yet gold dismissed near $1,076 eventually recovered and exceeded its earlier price. The claim of permanent destruction did not hold.
2020–2022: inflation does not prevent a fall
From $1,969 in August 2020 to $1,664 in October 2022, the monthly average lost 15.5%. Even amid inflation, interest rates and the dollar can weigh on gold. It reached $2,000 in April 2023, regaining the former peak after 32 months.
High inflation does not mechanically mean gold must rise immediately. Inflation, real rates, the dollar and investment demand interact. A period of adverse conditions can depress the price without eliminating the reasons for later buying.
2026: the outcome remains open
The latest complete monthly sample shows $5,020 in February 2026 and $4,073 in July, down 18.9%. August recovered to $4,411, followed by $4,319 in September: about 14.0% below February and 6.0% above July. October is incomplete and is not mixed into this monthly comparison.
Intraday moves were more severe. The World Gold Council’s July outlook reported a late-January intraday price above $5,500 and a late-June dip below $4,000, implying a fall exceeding 27%. Intraday extremes and monthly averages are different measures. [5]
WEI’s saved forecast data
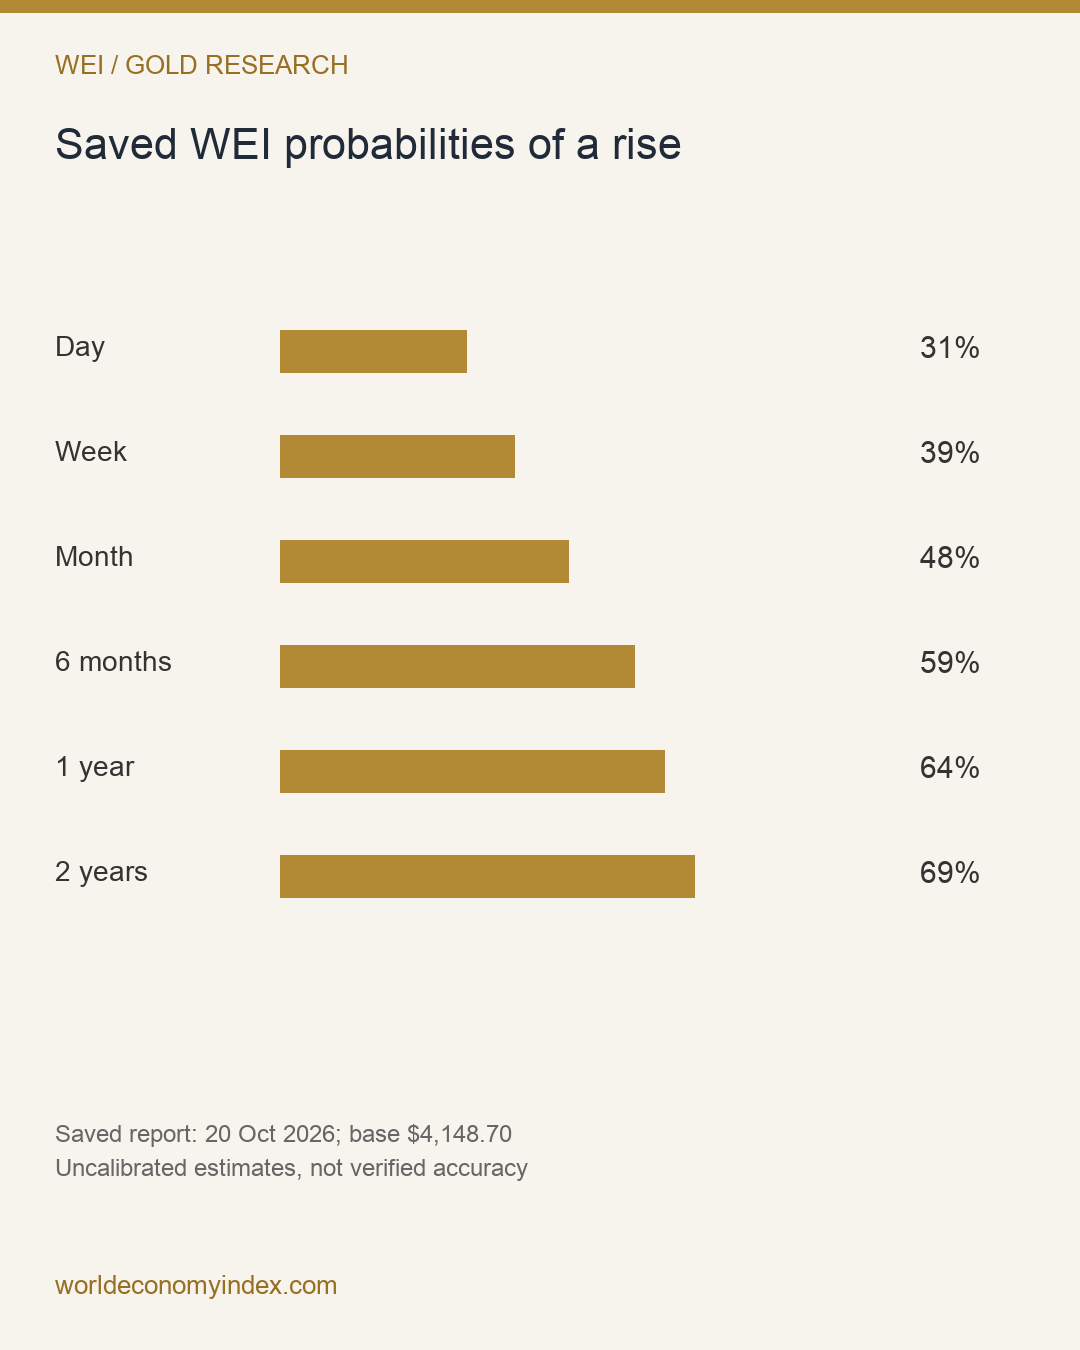
The latest completed gold report displayed in WEI was generated on 20 October 2026 at 18:31:58 in the page’s local time. All five AI providers returned six horizons. The figures below reproduce that saved report; they are not a new forecast generated on 25 October. Its reference price was $4,148.70 per troy ounce on 20 October.
The instrument is GC=F continuous gold futures reference data—not spot gold, nor the return from holding and rolling a particular delivery-month contract. Do not splice it directly into the World Bank monthly spot series. Source: WEI Forecast → Gold → Historical forecast reports → 20 October 2026.
WEI aggregate: up / flat / down
| Horizon | Target date | Up | Flat | Down |
|---|---|---|---|---|
| Day | 2026-10-21 | 31% | 38% | 31% |
| Week | 2026-10-28 | 39% | 15% | 46% |
| Month | 2026-11-23 | 48% | 11% | 41% |
| 6 months | 2027-04-21 | 59% | 5% | 36% |
| 1 year | 2027-10-21 | 64% | 4% | 32% |
| 2 years | 2028-10-23 | 69% | 3% | 28% |
Flat means cumulative change within ±0.5% of the original $4,148.70 base. Up means above about $4,169.44; down below about $4,127.96. All dates run from the original base, not today. The day target has passed. Probabilities are uncalibrated.
Each AI: probability of a rise
| AI | Day | Week | Month | 6 months | 1 year | 2 years |
|---|---|---|---|---|---|---|
| GPT | 27% | 38% | 47% | 55% | 58% | 60% |
| Claude | 33% | 42% | 50% | 60% | 64% | 66% |
| Gemini | 35% | 35% | 45% | 60% | 70% | 80% |
| Grok | 30% | 34% | 44% | 50% | 52% | 54% |
| DeepSeek | 30% | 45% | 55% | 70% | 75% | 83% |
What the disagreement means
The two-year probability of a rise ranges from Grok’s 54% to DeepSeek’s 83%, a 29-percentage-point gap. All lean toward a long-term rise, but their confidence differs markedly. GPT and Grok explicitly noted missing supply-demand, ETF-flow, positioning and macroeconomic data; the models mainly used historical prices. Claude noted short-term holdout errors indicating overestimation. These numbers document the report’s bullish tilt, not a fully validated fundamental win rate.
Six models: saved price point estimates
| Model | 6 months | 1 year | 2 years |
|---|---|---|---|
| ARIMA | 4,403.01 | 4,672.90 | 5,266.76 |
| Ridge | 4,378.88 | 4,614.27 | 5,171.81 |
| Random Forest | 4,458.17 | 4,766.16 | 5,188.32 |
| Gradient Boosting | 4,430.08 | 4,704.65 | 5,477.26 |
| Neural Network | 4,438.40 | 4,782.69 | 5,467.13 |
| AR(1) proxy | 4,403.52 | 4,673.49 | 5,267.52 |
Target dates: 21 Apr 2027 / 21 Oct 2027 / 23 Oct 2028. Model estimates, not AI-provider targets. The two-year $5,171.81–$5,477.26 range is model disagreement, not a confidence interval.
What the numbers support
The saved WEI report anticipated possible short-term pressure and a longer-term recovery bias. Its two-year aggregate assigned 69% to a rise and 28% to a fall. The article’s ‘Buy’ is WEI’s view combining this bias with the historical record; it does not mean tomorrow must rise. By 23 October the page showed a continuous-futures reference close of $4,007.90, about 3.4% below the original forecast base. That is not a final validation of forecasts whose horizons have not expired.
Why WEI’s answer remains Buy
Of the nine drawdowns in this sample, the first eight had regained their previous nominal monthly highs by the end of the sample; the ninth remained open. This is not a probability that future prices must rise, nor a 100% investment success rate. It does challenge the recurring claim that a sharp fall ends gold’s value.
Gold produces no corporate earnings and pays no interest. It is a physical asset that does not depend on one company remaining in business and can persist across monetary regimes. High rates increase its opportunity cost; a strong dollar can depress its quotation. Neither makes that characteristic disappear in a single correction.
WEI remains bullish because the current pullback does not establish a permanent reversal in long-term demand. Historical repricing supports that view; the sometimes very long recovery periods are its cost. This is a buying opinion, not a claim that a future rise has already happened.
Gold is falling. What should you do? WEI’s answer: Buy. The price has come down, while the case for long-term value remains.