War and BitcoinOne-Year Follow-Up Results
Five historical cases show why sharp selloffs, position unwinds and longer-term returns need to be examined separately. Five-minute open-interest records, settled funding rates and follow-up windows extending to one year reveal the limits of what war headlines can explain.
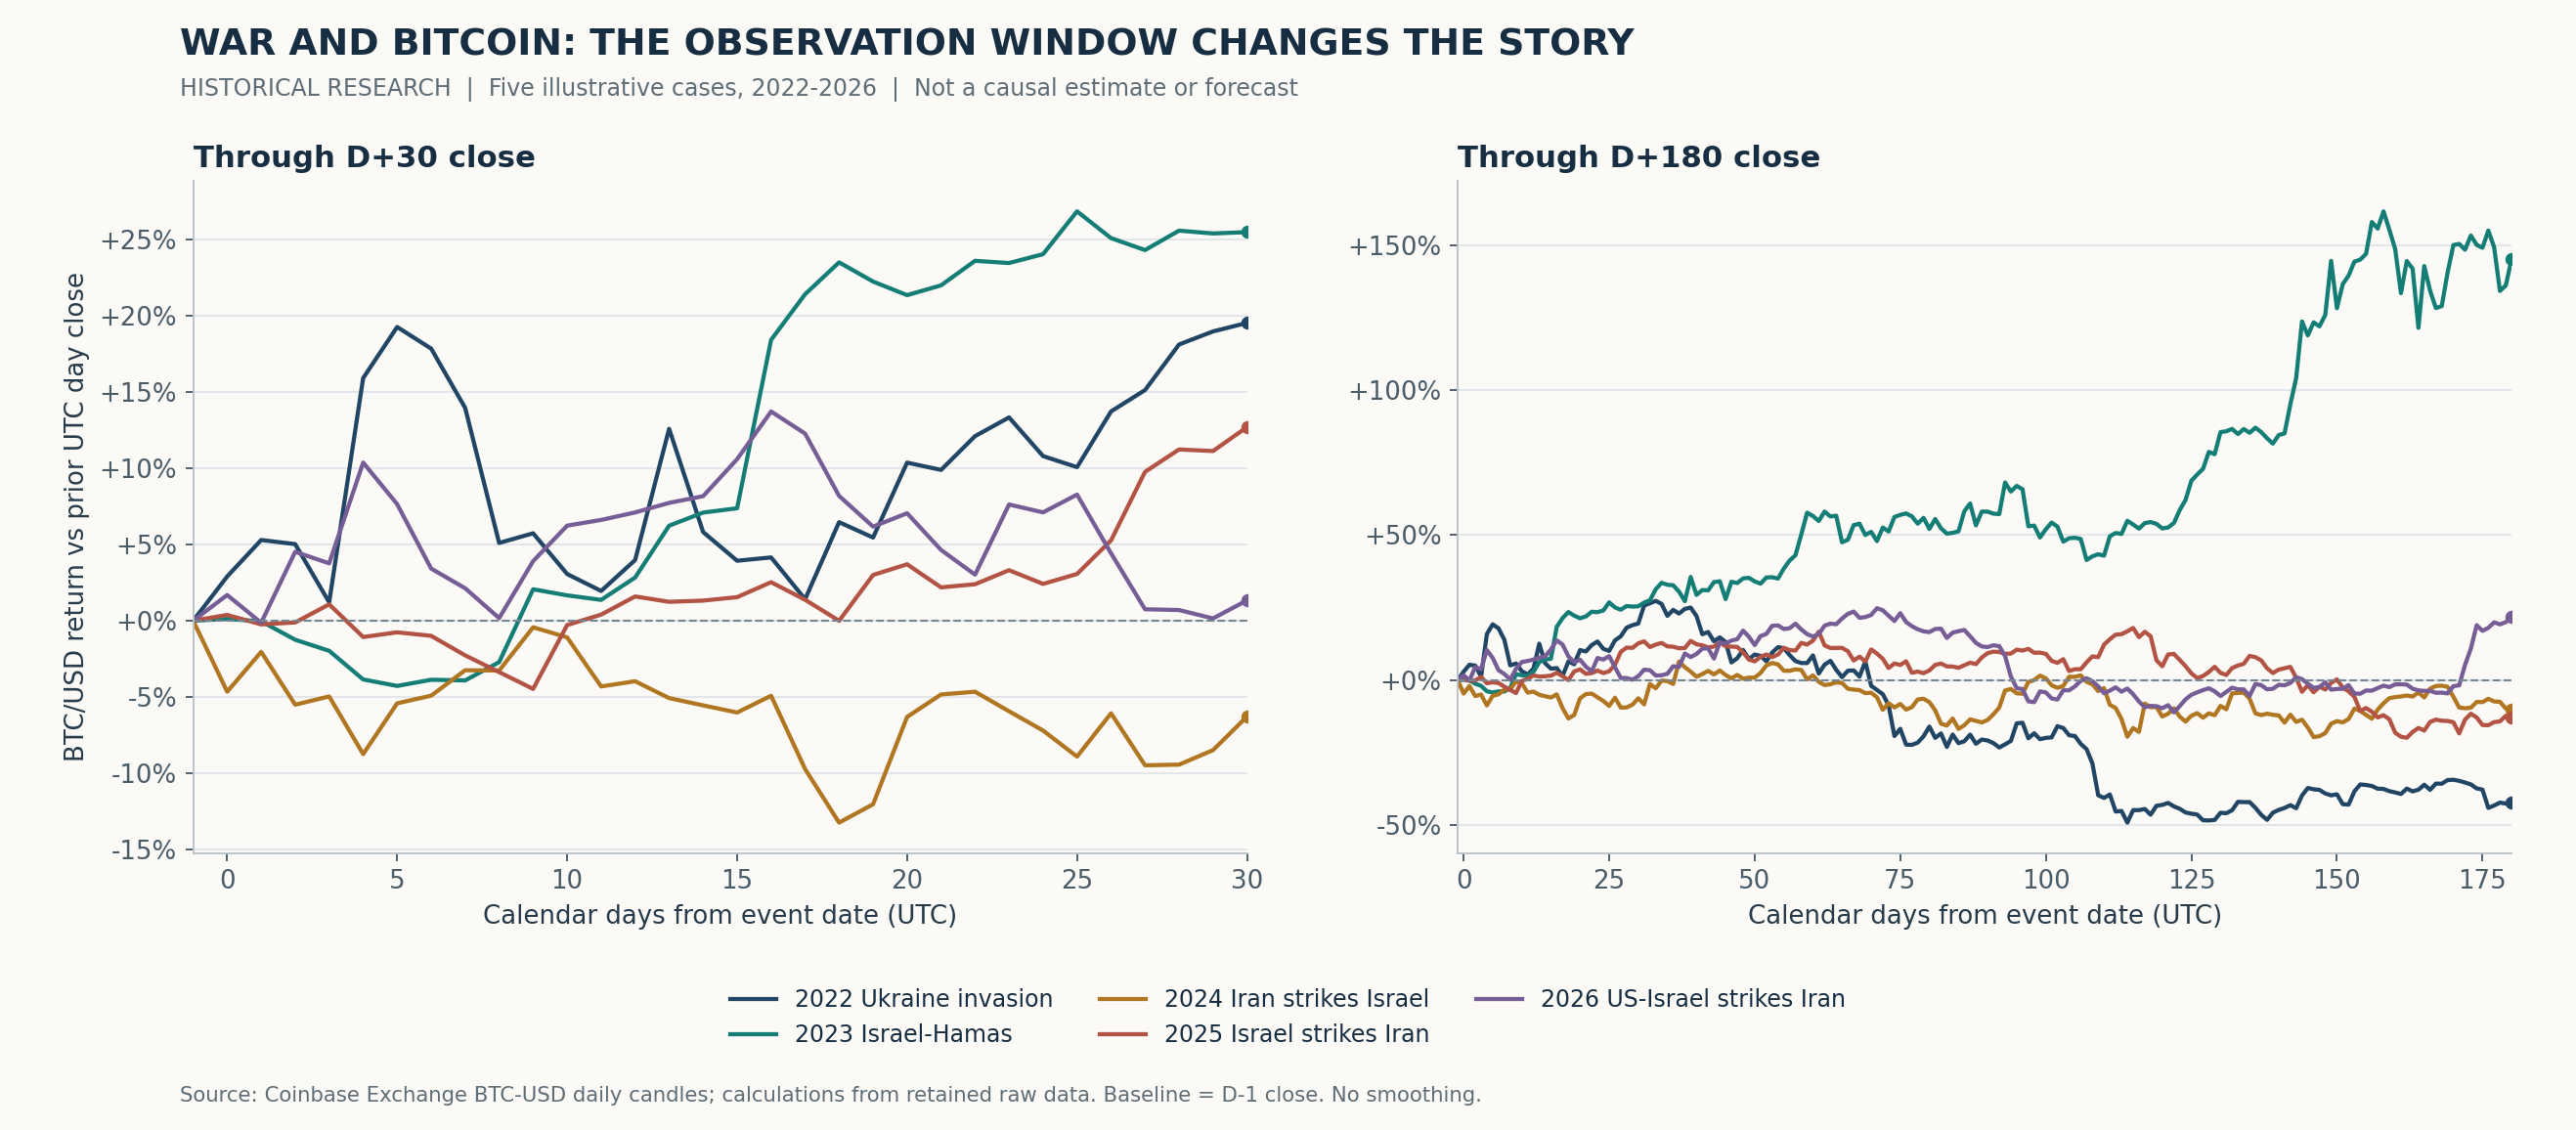
Russia launched its full-scale invasion of Ukraine on February 24, 2022. Thirty days later, bitcoin was up 19.51% from its pre-event close. Extend the window to 180 days and the result becomes a 42.23% loss. After one year, it was still down 37.78%.
The path after October 2023 was almost the reverse. Following the Hamas attack on Israel, bitcoin weakened over the first week, yet stood 145.21% above its pre-event close at the 180-day mark. Those two cases show how choosing a different endpoint can produce an entirely different story about trading a war.
A longer record does not turn war into a reliable buy-or-sell signal. It exposes two separate questions: which positions are forced out when the shock arrives, and which subsequent flows, policies and market events shape the price six months or a year later.
Short-Term Shocks, Longer-Term Paths
| Event date / event | D+30 | D+90 | D+180 | D+365 |
|---|---|---|---|---|
| 2022-02-24 · Russia invades Ukraine | +19.51% | -20.83% | -42.23% | -37.78% |
| 2023-10-07 · Hamas attacks Israel | +25.46% | +58.12% | +145.21% | +124.76% |
| 2024-04-13 · Iran attacks Israel | -6.28% | -13.76% | -10.23% | +24.70% |
| 2025-06-13 · Israel attacks Iran | +12.68% | +9.29% | -12.94% | -39.06% |
| 2026-02-28 · U.S. and Israel attack Iran | +1.33% | +11.40% | +21.89% | Window incomplete |
All returns use Coinbase Exchange BTC/USD spot prices and UTC daily closes, measured from the close on the day before each event. D denotes the event date; D+30, D+90, D+180 and D+365 refer to the closes on those calendar dates, not elapsed time from the news announcement. The one-year window for the 2026 case is incomplete and is left unreported.
One Year Later: Returns and Drawdowns
The one-year endpoint is consistently defined as the close 365 calendar days after the event date. The four cases from 2022 through 2025 have completed that window; the 2026 case has not. The table pairs the one-year return with the maximum drawdown measured using daily closes over the same period, rather than looking only at the final price.
| Event date / event | D+365 date | 365-day return | Maximum drawdown, daily closes, through D+365 |
|---|---|---|---|
| 2022-02-24 · Russia invades Ukraine | 2023-02-24 | -37.78% | -66.79% |
| 2023-10-07 · Hamas attacks Israel | 2024-10-06 | +124.76% | -26.23% |
| 2024-04-13 · Iran attacks Israel | 2025-04-13 | +24.70% | -28.17% |
| 2025-06-13 · Israel attacks Iran | 2026-06-13 | -39.06% | -51.21% |
| 2026-02-28 · U.S. and Israel attack Iran | 2027-02-28 (not yet reached) | Window incomplete | Window incomplete |
Maximum drawdown is measured from the running peak of the pre-event baseline and subsequent daily closes. It is neither the cumulative loss from the starting price nor the largest intraday decline. The window is a fixed 365 calendar days; when it spans a leap year, its endpoint can differ from the calendar anniversary.
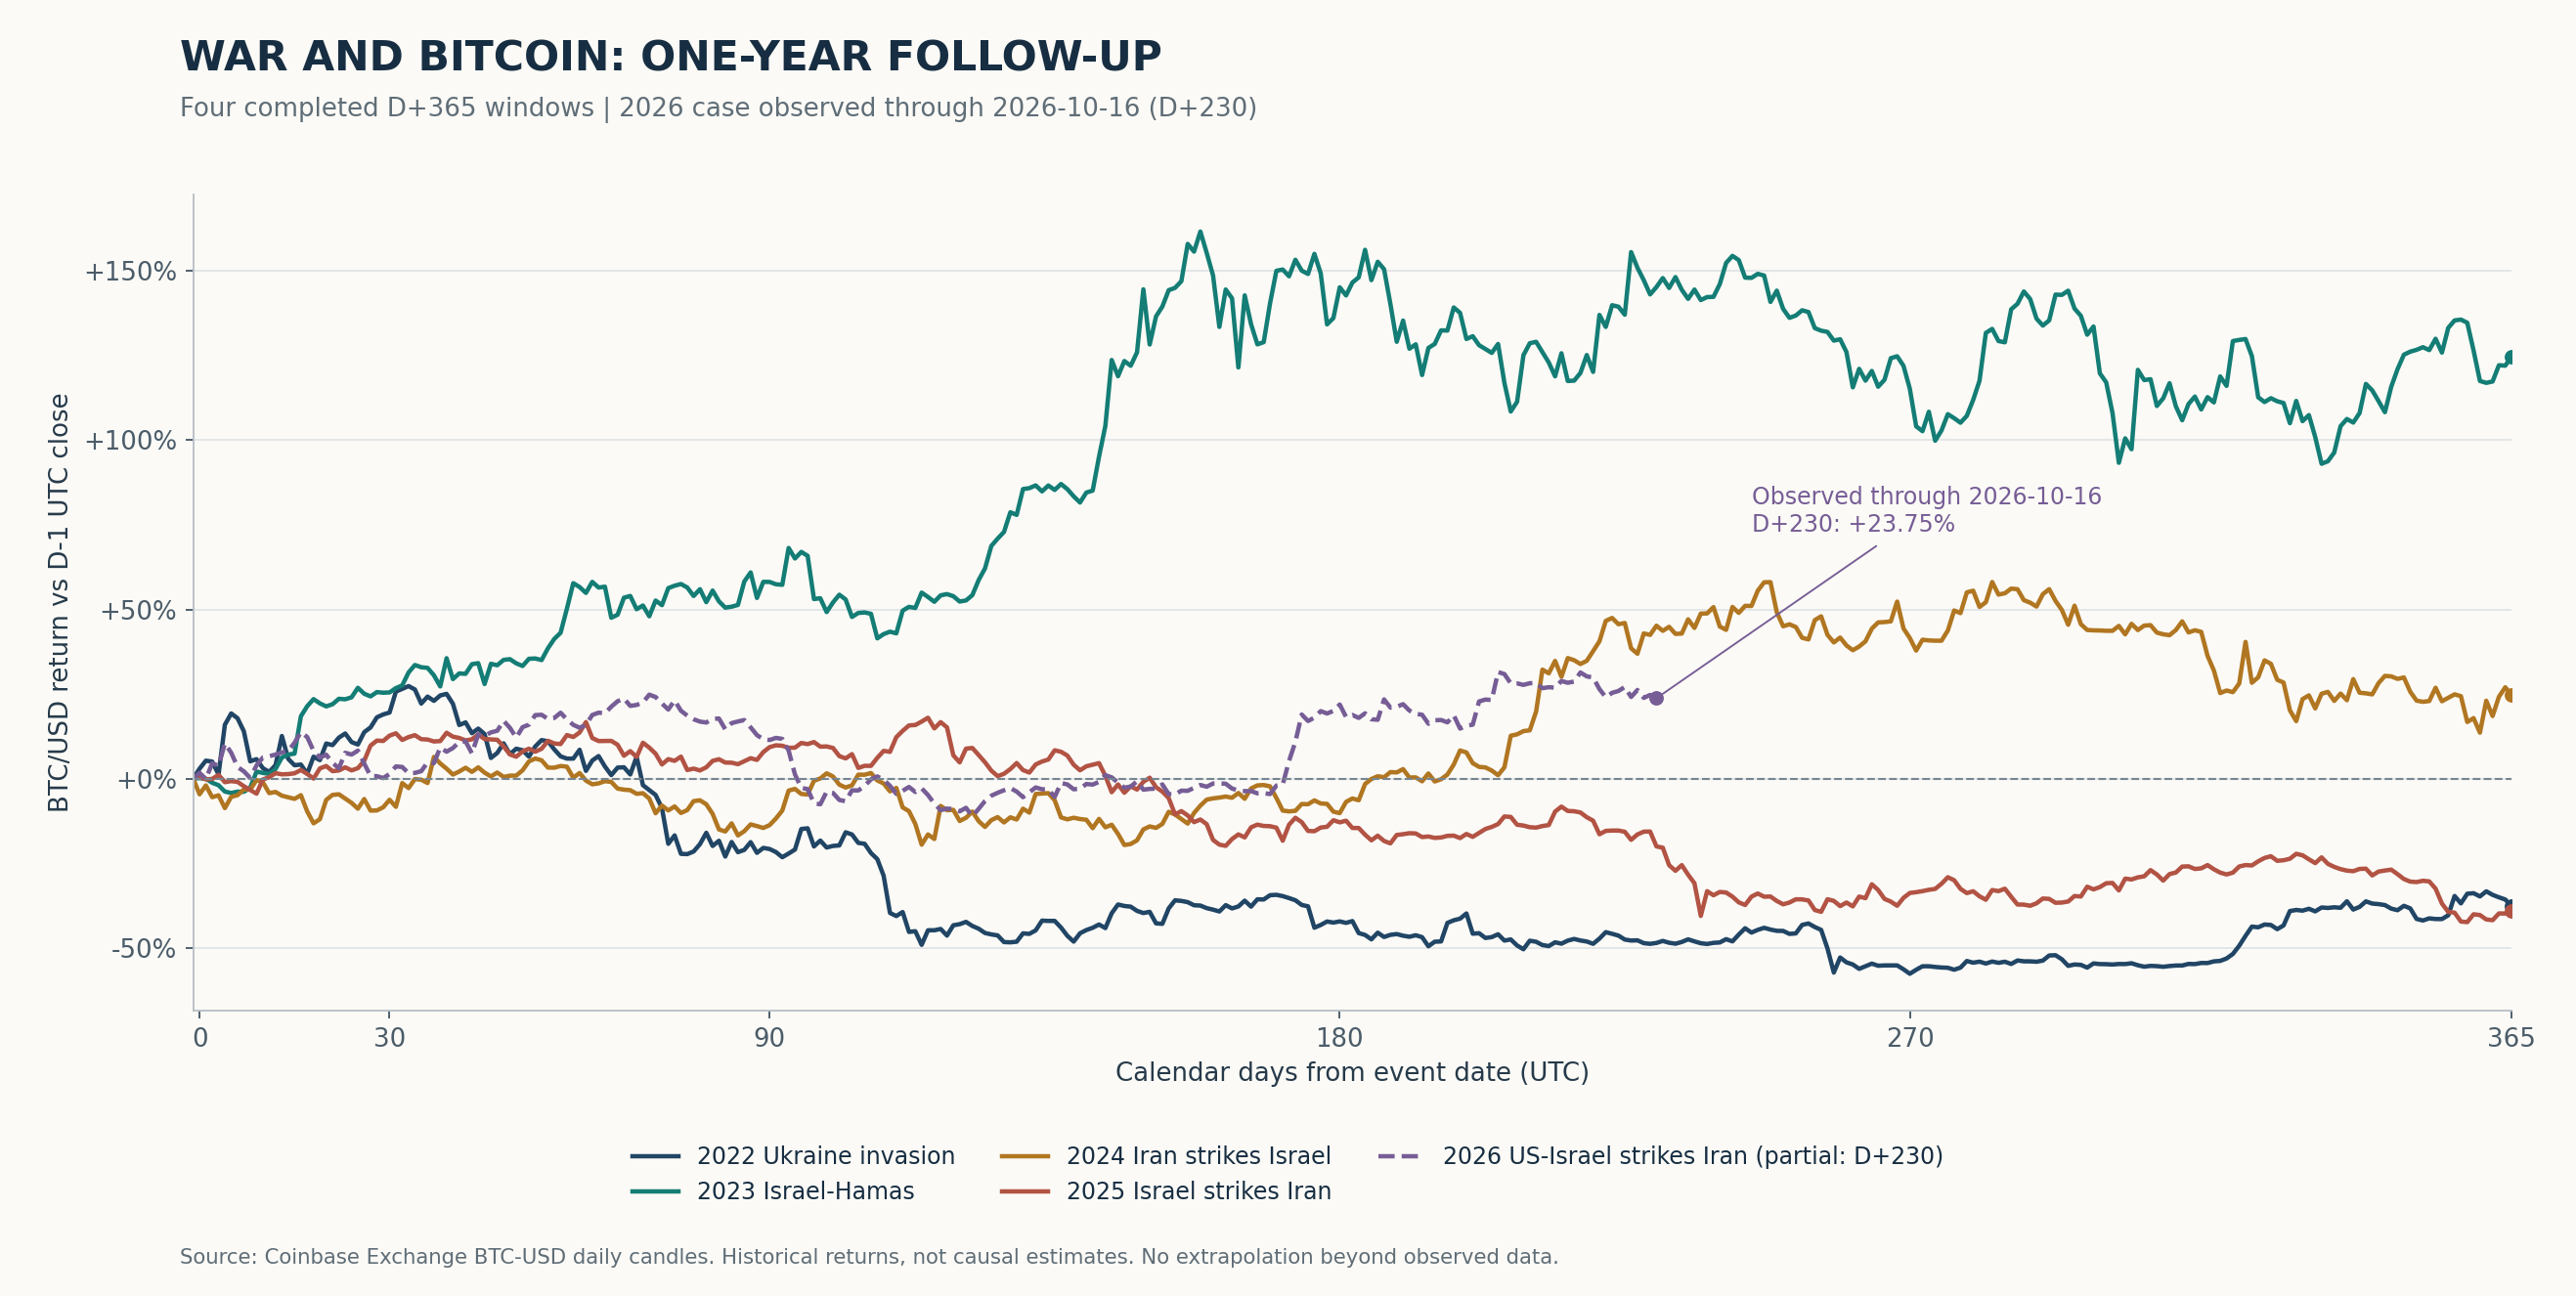
One year after the 2022 event, bitcoin was down 37.78%, having suffered a maximum drawdown of 66.79% on daily closes along the way. The 2023 case ended with a 124.76% gain but still included a 26.23% maximum drawdown. Similar event labels can coincide with very different market cycles, and an endpoint return is no substitute for measuring the risk encountered while holding.
The 2024 case was down 10.23% at D+180 but up 24.70% at D+365; its maximum drawdown over the year was 28.17%. The 2025 case moved from a 12.68% gain at D+30 to a 39.06% loss after one year, with a maximum drawdown of 51.21%. In these cases, extrapolating a short-term rebound into a year-long trend would have been unreliable.
The 2026 case is observed through October 16, 2026, or D+230, with a cumulative gain of 23.75% from the pre-event baseline. Its D+365 date is February 28, 2027. This article reports neither a one-year return nor a full-year maximum drawdown for that unfinished window, and does not describe a 230-day return as a one-year result.
The 2022 window also included Federal Reserve rate increases and the collapse of the Terra ecosystem. On March 16, the Fed raised its target range to 0.25%–0.50%; subsequent SEC materials describe UST losing its peg that May. Attributing the entire six-month return to the war would collapse distinct shocks into a single explanation. Federal Reserve statement; SEC release.
The 180-day window after the 2023 event spanned U.S. approval of spot bitcoin exchange-traded products. The SEC approved them on January 10, 2024. That change in market access is a confounding factor that must be considered; the price rise alone cannot establish that the war generated safe-haven demand. SEC approval statement.
The 2025 case also changed direction: a 12.68% gain at D+30 became a 12.94% loss at D+180 and a 39.06% loss at D+365. These are returns over specified intervals. They do not identify how much, if any, was caused by the war.
The 2024 Unwind: Separate Position Size From Price Effects
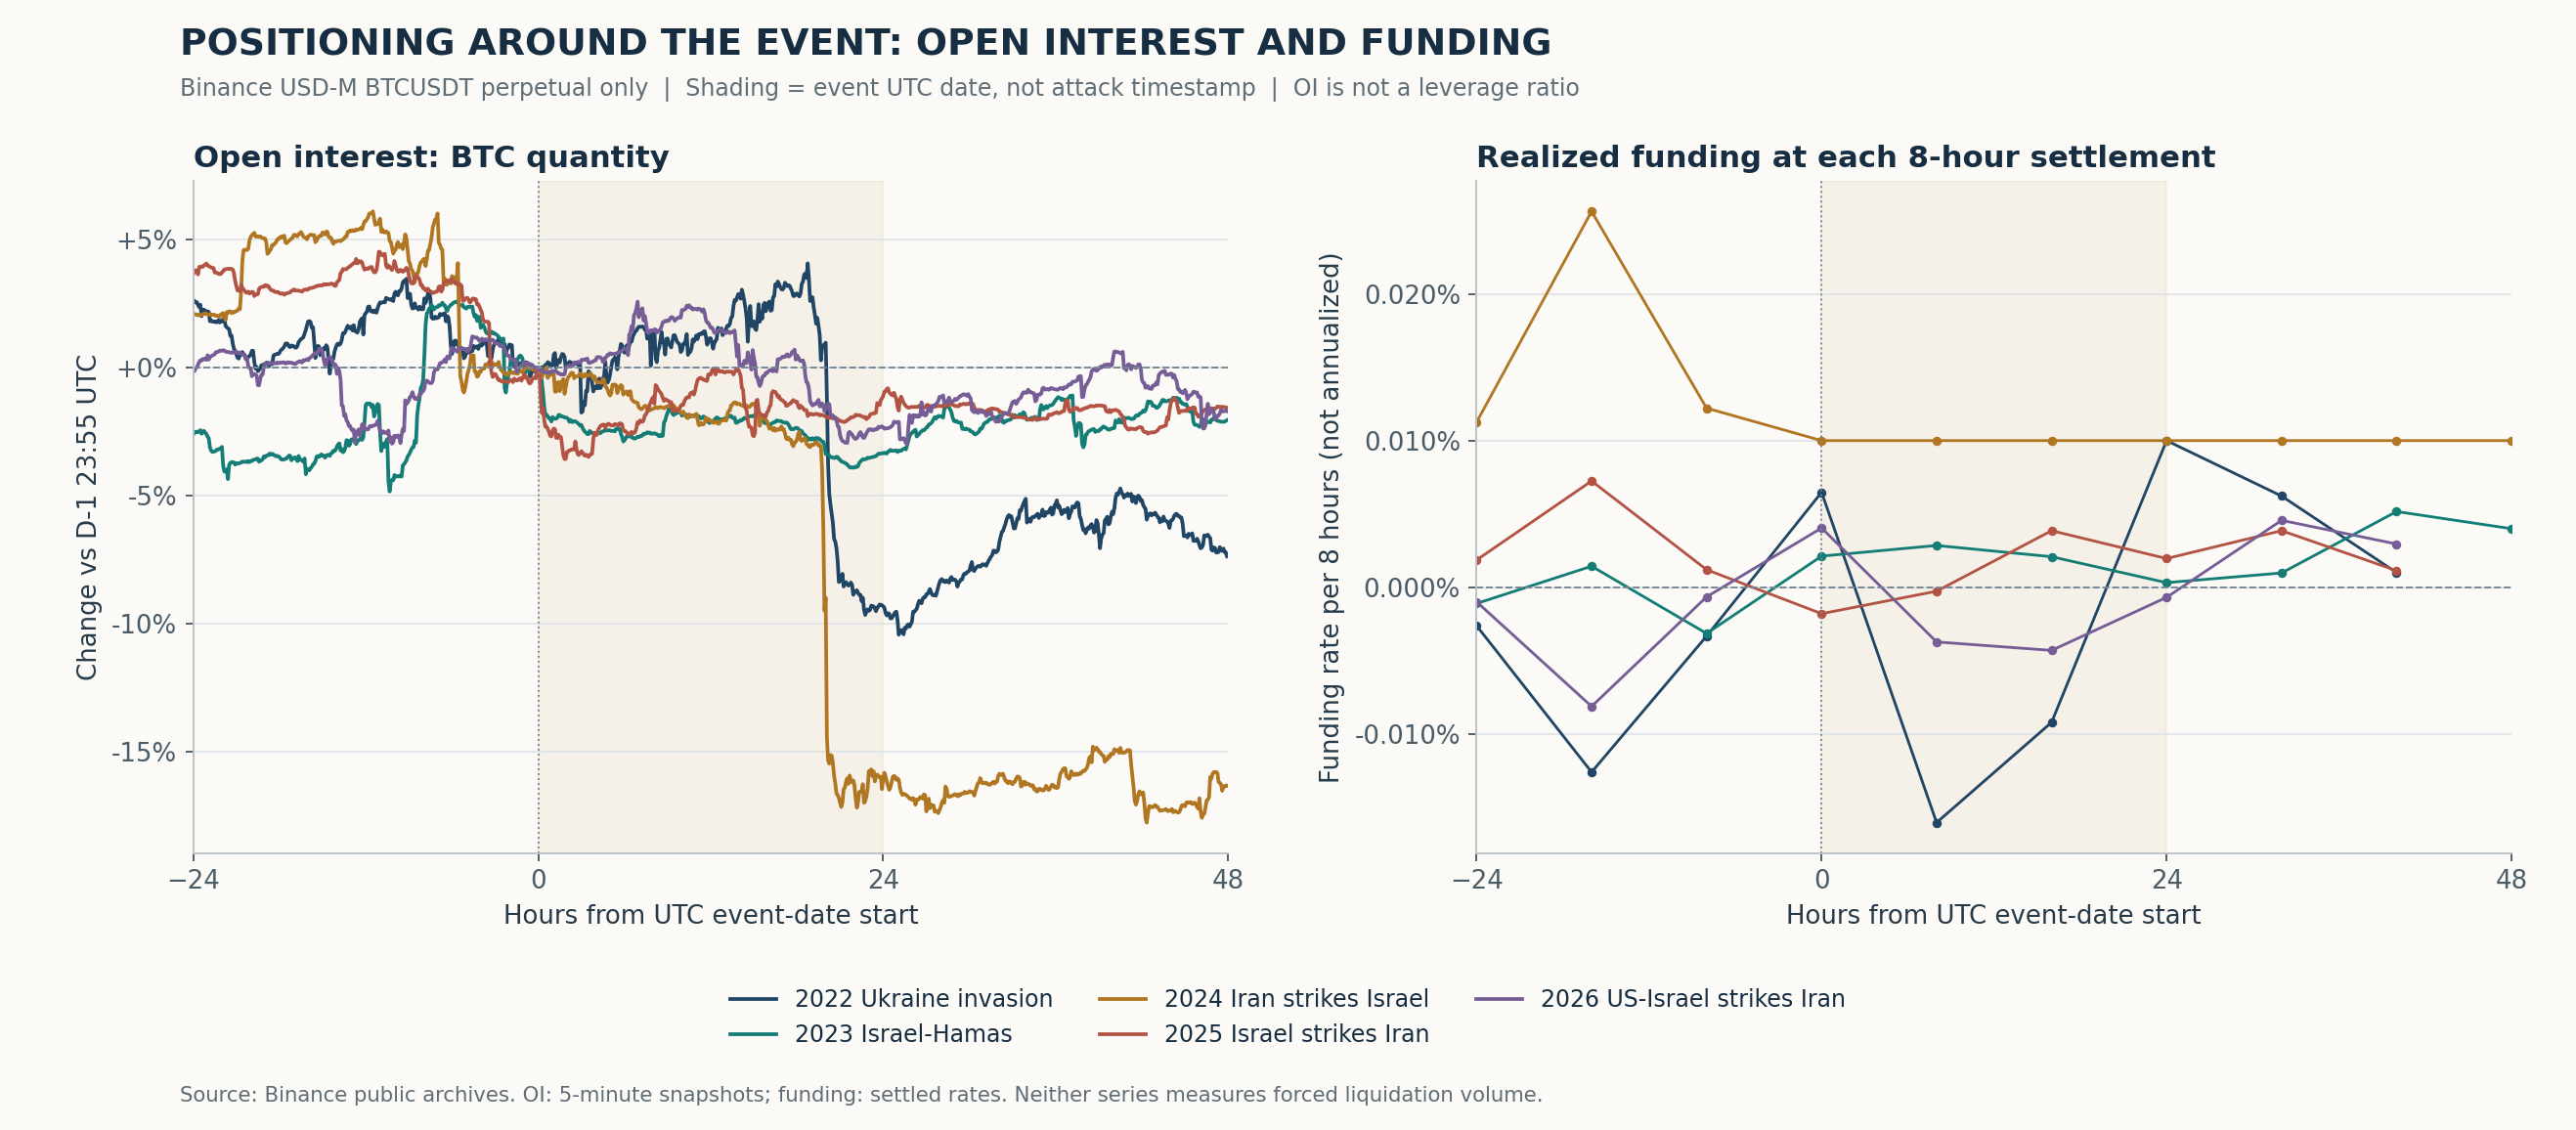
Binance’s public archives provide a closer view of derivatives positioning. Open interest in its USD-M BTCUSDT perpetual contract stood at 80,077.322 BTC at 23:55 UTC on April 12, 2024. By 23:55 on April 14, it had fallen to 67,002.787 BTC, a decline of 16.33%.
Over the same period, USDT-denominated notional open interest fell from approximately 5.377 billion USDT to 4.397 billion USDT, a decline of 18.23%. The substantial fall in BTC units shows that the notional contraction was not merely the mechanical effect of a lower bitcoin price. But open interest can decline through voluntary closing, forced liquidation or changes in strategy. The entire reduction in notional exposure cannot be called a liquidation loss.
| Event date | Open interest: before → end of next day (BTC) | Change in BTC units | Prior-day mean, per 8 hours | Lowest 8-hour funding, D and D+1 |
|---|---|---|---|---|
| 2022-02-24 | 73,734.292 → 68,299.200 | -7.37% | -0.006186% | -0.016045% |
| 2023-10-07 | 94,048.419 → 92,112.403 | -2.06% | -0.000940% | +0.000314% |
| 2024-04-13 | 80,077.322 → 67,002.787 | -16.33% | +0.016367% | +0.010000% |
| 2025-06-13 | 79,455.085 → 78,209.462 | -1.57% | +0.003434% | -0.001801% |
| 2026-02-28 | 79,180.596 → 77,832.776 | -1.70% | -0.003257% | -0.004305% |
Binance USD-M BTCUSDT perpetual only; this is not the whole market. The open-interest baseline is D−1 at 23:55 UTC and the endpoint is D+1 at 23:55 UTC. Funding rates are actual eight-hour settlements. The prior-day mean averages three settlements; the minimum covers six settlements on D and D+1. These are neither annualized rates nor measures of account leverage.
One funding-rate detail needs clarification. All six settlements for this Binance contract on April 13–14 were positive, at 0.010000%. Within the D−7 to D+7 window examined here, the first negative settlement occurred at 16:00 UTC on April 18, at −0.003334%. Any reference to contemporaneous research saying that funding “turned negative” therefore needs to specify the venue, contract and settlement time, or state that it concerns an intraday estimate. The series are not interchangeable.
Conditions before the 2026 event were different again. Bitcoin had already fallen 26.13% over the preceding 30 days, and the mean of this contract’s three funding settlements on the day before the event was negative. Treating all the pressure around the event as a reaction to a new war would overlook the adjustment already under way. The evidence warrants further examination of positioning; it does not establish that prior deleveraging determined the subsequent rally.
Liquidation Snapshots: Evidence With Gaps
Public historical liquidation figures are harder to standardize than prices or open interest. The table records CoinGlass snapshots quoted in contemporaneous reporting. They are secondary historical evidence, not a reconstructed transaction-level database aligned to a common cutoff. Rolling 24-hour windows may overlap and must not be added together. Totals for the entire crypto market must not be described as bitcoin-only liquidations.
| Report date | All crypto / rolling 24 hours | Long positions | Separate bitcoin total |
|---|---|---|---|
| 2022-02-24 | More than $411 million | Amount not separately reported | Not verified for the same window |
| 2023-10-07 | No reliably matched snapshot obtained | Unavailable | Unavailable |
| 2024-04-14 | About $955 million | About $767 million | Not separately reported |
| 2025-06-13 | More than $1.15 billion | More than $1 billion | No aggregate; one $200 million notional position reported |
| 2026-02-28 | More than $500 million | More than $420 million | Not separately reported |
The 2022 report separately cited approximately $72 million in bitcoin futures liquidations but did not give a distinct start and end time for that figure. This article therefore does not force it into the same window as the $411 million 24-hour total. The single $200 million position in the 2025 report refers to liquidated notional exposure; it does not establish that a trader lost $200 million of equity. Liquidation notional, account-equity losses and changes in market capitalization are different measures.
Sources: CoinDesk, 2022-02-24; ForkLog, 2024-04-14; CoinDesk, 2025-06-13; CoinDesk, 2026-02-28. A report’s publication time is not the underlying data cutoff. The 2025 rolling window includes trading on June 12, before the June 13 airstrikes, so the entire total cannot be attributed to those strikes.
One internally inconsistent liquidation account was excluded: its stated total of $962.4 million did not match the sum of $771.76 million in longs and $199.63 million in shorts. Without a contemporaneous original snapshot and transaction-level records, selecting one number to manufacture an apparently precise result would be unjustified.
What Endpoint Returns Conceal
| Event date | 180-day return | Maximum drawdown, daily closes, through D+180 | Lowest intraday price through D+180 vs baseline |
|---|---|---|---|
| 2022-02-24 | -42.23% | -60.07% | -52.86% |
| 2023-10-07 | +145.21% | -15.90% | -5.10% |
| 2024-04-13 | -10.23% | -24.47% | -26.95% |
| 2025-06-13 | -12.94% | -32.10% | -23.83% |
| 2026-02-28 | +21.89% | -28.80% | -12.36% |
Maximum drawdown measures the largest decline from a running peak to a subsequent closing trough, using the baseline and later daily closes. The lowest price relative to baseline is the lowest daily-candle low in the window compared with the D−1 close. The former measures the peak-to-trough path; the latter measures the deepest fall below the starting reference. Neither is a causal estimate of war’s effect.
The 2026 case ended its 180-day window with a 21.89% gain, yet experienced a maximum drawdown of 28.80% on daily closes. In the 2022 case, a 42.23% endpoint loss came with a 60.07% maximum drawdown along the way. A period that finishes in profit can still contain a deep drawdown, and a post-event rebound does not mean that risk has disappeared.
The additional evidence sharpens the conclusion. Some events coincided with a marked contraction in positions, and long liquidations can amplify short-term pressure. Changing the observation window can also reverse the sign of the return. War headlines, derivatives unwinds and bitcoin’s price six months later need to be examined on a common timeline, rather than assigned a single bullish or bearish label.
Identifying war’s independent effect would require a broader, predefined event sample, precise news timestamps, non-event control windows and adjustments for market benchmarks, monetary policy, ETFs and other factors. This article remains an auditable historical case study.
Data and Reproducibility
- Prices: Coinbase Exchange BTC/USD spot. Original JSON, retrieval timestamps and SHA-256 hashes are retained. Daily candles are continuous within each window; no interpolation is used.
- Derivatives: 20 daily open-interest archives from Binance, each containing 288 five-minute records, checked for date alignment, duplicates and gaps; eight monthly funding-rate files containing 717 settlements.
- Open interest measures outstanding contract exposure; funding rates indicate the direction and cost of payments between positions. Neither reconstructs actual account leverage or directly measures forced-liquidation volume.
- A consistently defined, market-wide, transaction-level BTC liquidation series was not obtained for all five events. Reported liquidation snapshots are stored separately from exchange series recalculated for this study. Unknown fields remain null.
- The data cutoff is fixed at 2026-10-16. The unfinished one-year return for the 2026 case is neither estimated nor filled with zero.
One-year follow-up CSV · One-year chart PDF · Longer-term returns CSV · Full price paths CSV · Five-minute open interest CSV · Funding settlements CSV · Positioning metrics and timestamps · Liquidation evidence and gaps · Methodology and limitations
Research only; not investment advice. Historical returns are not forecasts or estimates of war’s causal effect.